Alerts
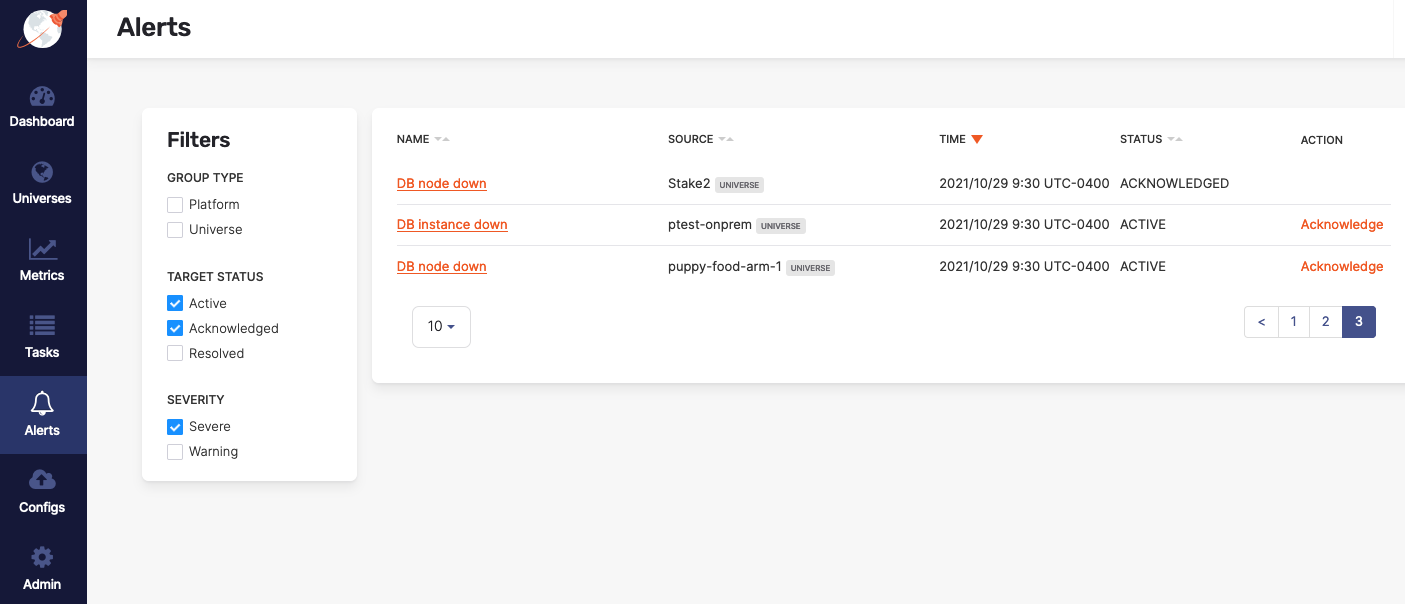
YugabyteDB Anywhere allows you to view a list of generated alerts and manage these alerts by navigating to Alerts, as per the following illustration:

By default, the list is sorted in reverse chronological order by the alert issue time. You can reorder the list by clicking column headers.
For information on configuring your alerts, both for universe and YugabyteDB Anywhere metrics, refer to Create and configure alerts.
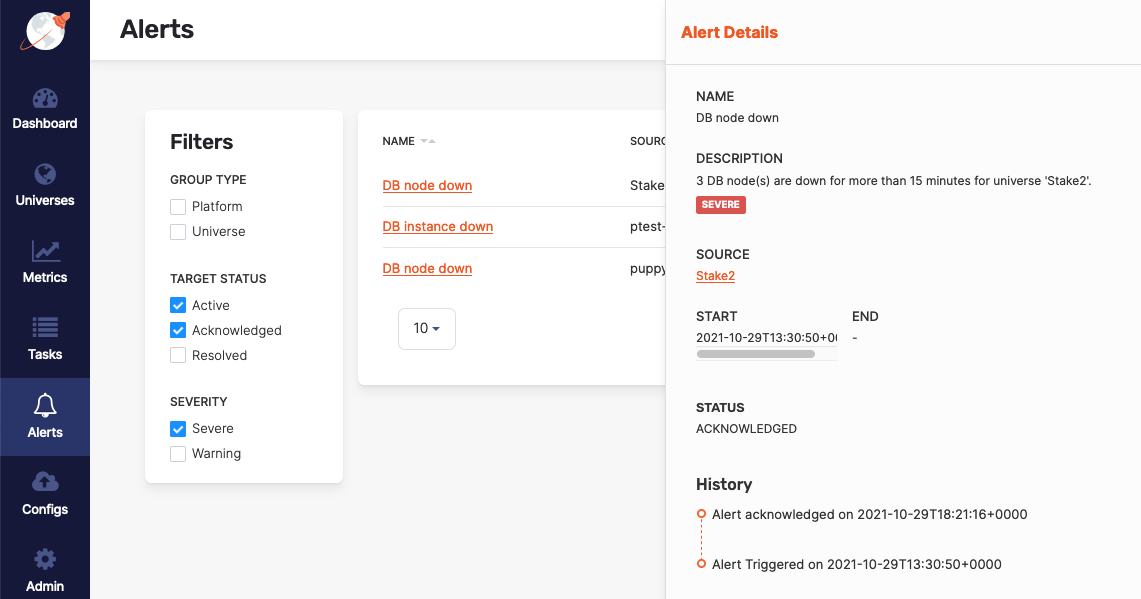
You can access detailed information about a specific alert by clicking on its name to open the Alert Details dialog shown in the following illustration:

The alert status and time frame provide information on when the threshold was exceeded during the most recent alert check.
The alert status can be active, acknowledged, or resolved. You change the status by taking an appropriate action.
For example, suppose there is an alert rule that checks if the average CPU utilization is higher than 75% for 15 minutes. In this case, the alert is triggered for as long as the CPU usage is higher than 75%. To avoid receiving continuous alerts, you can either acknowledge the active alert, thereby preventing YugabyteDB Anywhere from sending additional notifications to the alert's destination, or you can resolve the alert by addressing the condition that triggered it.
Note that if you are using a read-only account for YugabyteDB Anywhere, you cannot perform Alert actions.