Large datasets
Use this benchmark to understand the performance, failure, and scaling characteristics of YugabyteDB with a massive dataset (multiple TB per node). In order to accomplish that, you will do the following:
- Load 30 billion key-value records
- Each write operation inserts a single record
- Perform a read-heavy workload that does random reads in the presence of some writes
- Perform a read-heavy workload that does reads of a subset of data in the presence of some writes
Each record is a key-value record of size almost 300 bytes.
- Key size: 50 Bytes
- Value size: 256 Bytes (chosen to be not very compressible)
Recommended configuration
Note that the load tester was run from a separate machine in the same availability zone (AZ).
Machine types
A machine in the Amazon Web Services (AWS) cloud with the following specifications was chosen: 32-vcpus, 240 GB RAM, 4 x 1.9TB nvme SSD.
- Cloud: AWS
- Node type: i3.8xlarge
Cluster creation
Create a standard four-node cluster, with replication factor (RF) of 3. Pass the following option to the YugabyteDB processes.
--yb_num_shards_per_tserver=20
The yb_num_shards_per_tserver was set to 20 (default value is 8). This is done because the i3.8xlarge nodes have four disks. In future, YugabyteDB will automatically pick better defaults for nodes with multiple disks.
Create the YCQL_ADDRS environment variable using the export command:
$ export YCQL_ADDRS="<ip1>:9042,<ip2>:9042,<ip3>:9042,<ip4>:9042"
Initial load phase
The data was loaded at a steady rate over about 4 days using the CassandraKeyValue workload. To load the data, run the following command:
$ java -jar yb-sample-apps.jar        \
      --workload CassandraKeyValue    \
      --nouuid --nodes $YCQL_ADDRS    \
      --value_size 256                \
      --num_unique_keys 30000000000   \
      --num_writes 30000000000        \
      --num_threads_write 256         \
      --num_threads_read 1
Write IOPS
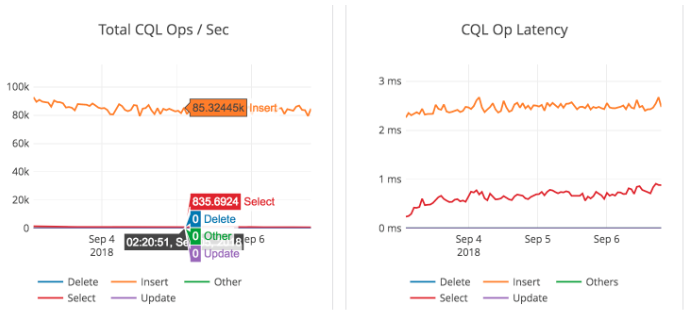
You should see a steady 85,000 inserts per second with write latencies of around 2.5 milliseconds. This is shown graphically below.

Data set size growth rate
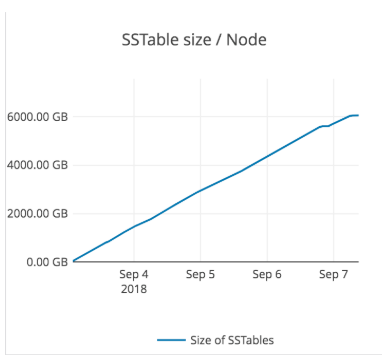
The graph below shows the steady growth in SSTables size at a node from Sep 4 to Sep 7 beyond which it stabilizes at 6.5 TB.

Final data set size
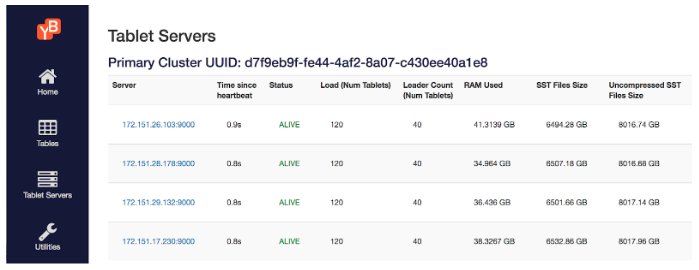
The following illustration is from the yb-master Admin UI that shows the tablet servers, number of tablets on each, number of tablet leaders, and size of the on-disk SSTable files.
Note
The uncompressed dataset size per node is 8 TB, while the compressed size is 6.5 TB. This is because the load generator generates random bytes, which are not very compressible.
Real world workloads generally have much more compressible data.

Expected results
The results you see should be similar to the observations shown below.
Load phase results
| Name | Observation |
|---|---|
| Records inserted | 30 Billion |
| Size of each record | ~ 300 bytes |
| Time taken to insert data | 4.4 days |
| Sustained insert Rate | 85K inserts/second |
| Final dataset in cluster | 26TB across 4 nodes |
| Final dataset size per node | 6.5TB / node |
Read-heavy workload results
| Name | Observation |
|---|---|
| Random-data read heavy workload | 185K reads/sec and 1K writes/sec |
| Recent-data read heavy Workload | 385K reads/sec and 6.5K writes/sec |
Cluster expansion and induced failures
- Expanded from four to five nodes in about eight hours
- Deliberately rate limited at
200 MB/sec
- Deliberately rate limited at
- New node takes traffic as soon the first tablet arrives
- Pressure relieved from old nodes very quickly
- Induced one node failure in five-node cluster
- Cluster rebalanced in
2 hrs 10 minutes
- Cluster rebalanced in